Governor and health commissioner say they look at data models to guide their decisions, but ‘don’t have something to share’
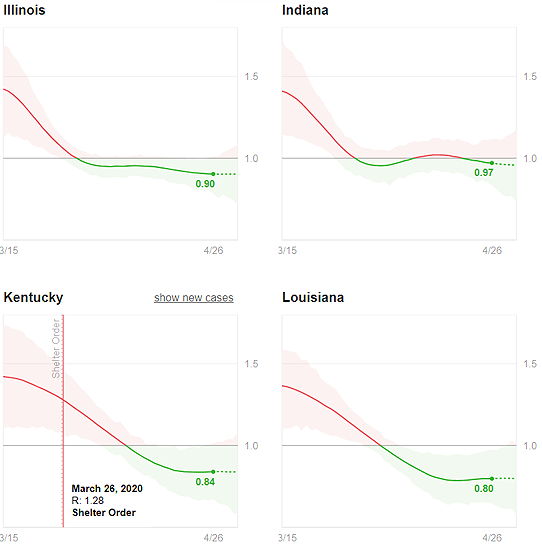
Graphs from the rt.live website show the likeliest transmission rate of the coronavirus, within estimated ranges. A rate of 1 is an estimate that one infected person will infect one other person, and so on.
—–
By Dalton Stokes and Al Cross
The (Frankfort) State Journal and Kentucky Health News
State-by-state by state figures have been revised to reflect an adjustment by the estimators.
Gov. Andy Beshear said this Wednesday about his slow, gradual steps to reopen the state: “If it proves that we can’t do any of them safely, it is always subject to pause.”
But the weekly rolling average of new coronavirus cases hit a new high Friday. How will he know when to pull the plug?
In some other states, governors give considerable attention to two statistical models used to track the spread of the virus, but Beshear and Health Commissioner Steven Stack are keeping to themselves whatever models they are using.
Epidemiologists measure reproduction of a virus with a figure called R0, or “R naught.” It represents the number of infections, on average, that stem from a single infection.
A related number, called Rt, for transmission, uses statistical adjustments to create a more current estimate of how fast a disease is spreading, or what epidemiologists call the effective reproduction number of a virus.
Asked at Beshear’s briefing Wednesday if the state Department of Public Health calculates those figures, and if so, what they are, Stack said: “Yes, we do try to calculate those numbers, but I don’t have any great confidence in them,” because they depend on so many varying factors.
“We do look at those things,” Stack said, “but I don’t have something to share.”
A website created by the co-founders of Instagram estimates the virus’ Rt value in each state daily. Natalie E. Dean, an assistant professor of biostatistics at the University of Florida, told Vox that the model, as well as the data behind it, seem sound.
The site estimates the likeliest rate within a range of possibilities. It reckons that Kentucky’s Rt on April 25 was 0.88, just about in the middle among the states. The estimate for April 26 was 0.84, after the site revised its methodology, adjusting most states’ figures downward.
Among the states bordering Kentucky, most have lower Rt estimates; Illinois has about the same, and only Indiana has seen a resurgence. Its estimate fell to 0.95 in early April, then rose to 1.02 on April 15. Its latest estimates have been just below 1.
New York Gov. Andrew Cuomo said Tuesday that his plan uses Rt as a “circuit breaker,” set to 1.1. If the state jumps to 1.1, or higher, his reopening efforts will be reversed. New York’s latest estimate is 0.83, but New York City has been a hotspot that could easily have a resurgence.
Dean told Vox that the accuracy of the R0 and Rt estimates hinges on the amount of testing in a state. If states don’t increase testing proportionate to the growth of the virus, they will report the same relative number of new cases each day, even if there are actually more.
While Stack wouldn’t say what numbers he and Beshear are using, he said the difference in the Rt estimate and the basic R0 number for the coronavirus shows the effectiveness of the measures they have taken.
“The R0 for this disease is … closer to 3 when it’s unchecked,” he said. The number means that if no measures had been taken to contain the virus, each infected person would have infected three other people, and those three would have infected nine more, and so on.
“We are trying to do the best we can,” Stack said, “to balance the societal need to resume activities that are so important to society, but to keep people safe.”
 |
| Chart by rt.live, last updated 11:23 a.m. Saturday, May 2 |
Beshear has said for two weeks that the state’s daily number of new cases is at a plateau, or relatively so, but the rt.live chart for new cases shows the seven-day rolling average has slowly increased over that time, and reached a new high Friday. A seven-day average is used to smooth out daily differences, which can be driven by laboratory reporting schedules, testing patterns and other factors.
Information for this story was also gathered by Melissa Patrick of Kentucky Health News.