Ky. Covid-19 cases and positivity rate increased last week, but hospital numbers kept nearly stable and deaths hit 11-month low
Graph by Kentucky Health News from state data; click on it to enlarge.
—–
By Melissa Patrick
Kentucky Health News
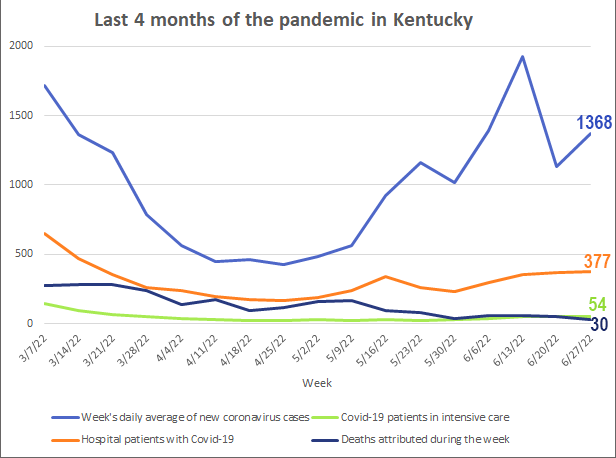
While most of Kentucky’s pandemic metrics went up last week, hospital cases went up only a bit, and fewer deaths were attributed to the disease than in any week in the last 11 months.
The state’s weekly report for Monday through Sunday shows 9,574 new coronavirus cases, an average of 1,368 per day. That’s 21 percent more than the week before, when the rate was 1,132 cases per day.
Of last week’s new cases, 13.6% were in people 18 and younger. Covid-19 vaccinations for children aged 6 months to 5 years old were recently approved and have been available for those 5 and older for some time.
Both the Moderna and Pfizer-BioNTech vaccines became available to those 5 and younger at UK HealthCare Monday. While clinics are just beginning to offer them across the state, they are expected to become widely available to this age group by early July.
The share of Kentuckians testing positive for the virus last week continues to tick up. Today, that rate is 13.36%, up from 12.45% the prior week. The figures do not include at-home tests.
The statewide incidence rate increased to 26.6 cases per 100,000 residents, up from 24.41 in last week’s report. The top 10 counties were Perry, 51; Marion, 46; Montgomery, 45.2; Taylor, 40.5; Harlan, 39.5; Owen, 39.3; Hardin, 39.3; Hickman, 39.1; Muhlenberg, 38.7; and Washington, 37.8.
The New York Times ranks Kentucky’s incidence rate 12th in the nation, with a 2% increase over the last two weeks.
The state reported 30 more Covid-19 deaths last week, an average of 4.3 per day, much lower than the 7.3 daily rate the previous week and the lowest since last Aug. 3. The state’s pandemic death toll is 16,144.
Kentucky’s Covid-19 hospitalization numbers remained nearly steady, even as they slowly increase. Kentucky hospitals reported 377 patients with Covid-19 Monday, up from 369 a week ago, with 54 in intensive care (up 6) and 18 on mechanical ventilation (down 7).
The latest CDC national Covid-19 risk map, which measures cases and hospital capacity, shows 22 counties with a high level of coronavirus transmission and 37 with a medium risk. The map is updated on Thursday evenings.