More than 1/3 of Kentuckians are enrolled in Medicaid. How many in your county? How many kids? What are their big health issues?
By Al Cross
Kentucky Health News
Most Kentuckians probably don’t know much about Medicaid, but for more than one in three people in the state, it is a lifeline. In some counties, more than half the residents are Medicaid beneficiaries. But Medicaid runs somewhat under the radar, because many Kentuckians frown on the receipt of public assistance — even though Medicaid benefits come only with demonstrated medical need.
Medicaid is a combined federal-and-state program, created in 1965 by the law that created Medicare. Originally it was for the very poor, the disabled and the pregnant, but in 2014 expanded to households with incomes up to 138 percent of the federal poverty level because then-Gov. Steve Beshear embraced the 2010 Patient Protection and Affordable Care Act, better known as Obamacare.
The federal government pays 90 percent of the cost for people covered by the expansion, and about 72 percent of others’ costs. The state pays the rest, which means Kentucky taxpayers put billions of dollars a year into it. It’s not the sort of program that needs to run under the radar; if we are paying the freight, we need to know what’s in the haul, and it helps to know it at the local level.
That’s easier now that the state Cabinet for Health and Family Services, which runs Medicaid in Kentucky, has posted monthly Medicaid enrollment reports on its website.
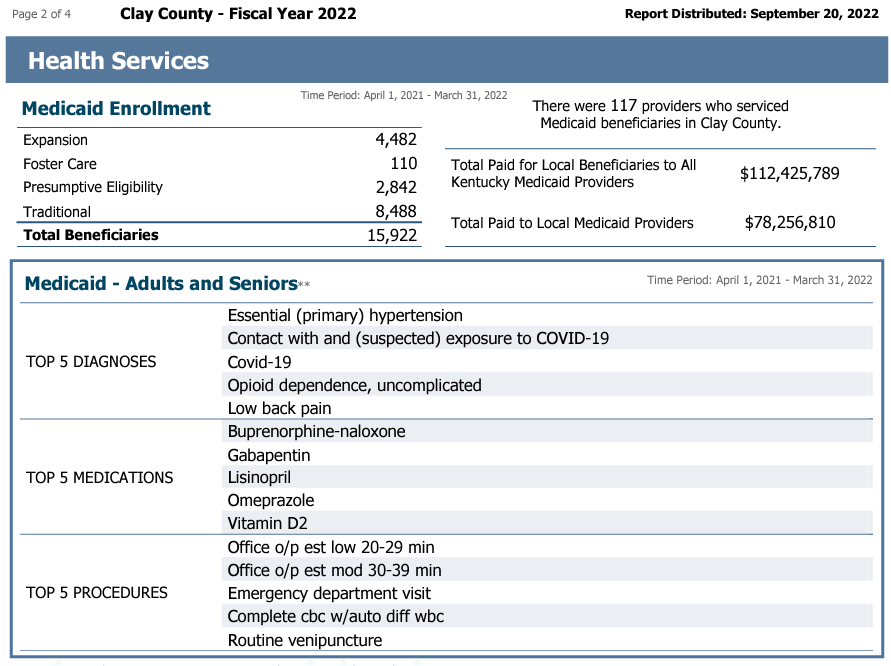
These county-by-county reports are more useful than the annual reports that the cabinet circulates more more to show the local impact of its programs. The Medicaid figure on those reports is the number of people in the county who received Medicaid benefits at any time during the program’s fiscal year (April to March). That number overstates the rolls at any particular time, because many people go on and off Medicaid each month.
For example, the Fiscal 2022 report for Clay County, one of the nation’s poorest, shows 15,922 total beneficiaries in the year, but only 12,815 in the month of June. That is still 62.6 percent of the county’s estimated population of 20,484.
That said, the annual reports provide much more information about Medicaid than the monthly reports; among other things, they:
- Break down Medicaid enrollment into types of enrollees: traditional, expansion, children in foster care, and “presumptive eligibility,” people who have been enrolled during the pandemic without all the usual checks for eligibility, under legislation passed by Congress. Starting April 1, states will have to start running all the usual checks, and many people will no longer be eligible. In Clay County, for example, 2,842 presumptive eligibles were on the rolls in fiscal 2022, or 18% of the total enrollment.
- Give the number of children who were beneficiaries at any time during the year; in Clay County, 4,612 kids were helped by Medicaid in fiscal 2022.
- Give the top five diagnoses for adults and children on Medicaid, which can vary widely from year to year. In another poor county, Clinton, the top five diagnoses for adults in fiscal 2021 were chronic obstructive pulmonary disease, hypertension, unspecified illness, opioid dependence and diabetes, in that order. In fiscal 2022, they were hypertension, Covid-19, contact with and suspected exposure to Covid, myopia (nearsightedness) and “other fatigue.”
- Give the top five procedures performed on beneficiaries and the top five medications prescribed for beneficiaries. In both Clay and Clinton counties in the last two fiscal years, the most-prescribed drug was naloxone, which reverses the effect of a drug overdose.
- Show the number of health-care providers who served residents of the county and the total they were paid. For example, in Clinton County in fiscal 2022, residents were served by 48 providers who were paid $33 million; $14.3 million of that went to local providers.
- Show the number of newborn screenings and other figures on programs for children, including the percentages of foster children who had an official goal of adoption, and the number with other official goals, such as reunification with their birth families.
The annual reports give much information on programs other than Medicaid, such as the Supplemental Nutrition Assistance Program (once known as food stamps), behavioral-health services (including syringe exchanges), other services by local health departments, health-insurance assistance, child-care assistance, child-support enforcement, social services (such as meals, home care and other services to seniors), and funding of Family Resource and Youth Service Centers, which serve public-school students and their families. The reports also list the number of cabinet employees working in each county.